Introduction
Coming out of the roughly 10% correction into October last year, share markets saw strong gains on hopes that lower inflation will allow central banks to cut interest rates and as global profits have remained strong. The going seems to have become tougher though with share markets falling in April amidst interest rate and geopolitical concerns begging the question as to whether it’s maybe now time to “sell in May and go away” given the old saying, in reference to seasonal patterns in shares.
Seasonal patterns in shares
Seasonal patterns have long been observed in share markets. The “January effect” was perhaps the most famous, where January typically provided the best gains, but anticipation of it has seen it morph into December and now November. However, it’s really part of a broader seasonal pattern, which over long periods has been positive for shares from around October to around May and then weaker to September. This can partly be seen in the pattern of average monthly share prices changes since 1985 shown in the next chart.
The seasonal pattern in shares
Source: Bloomberg, AMP
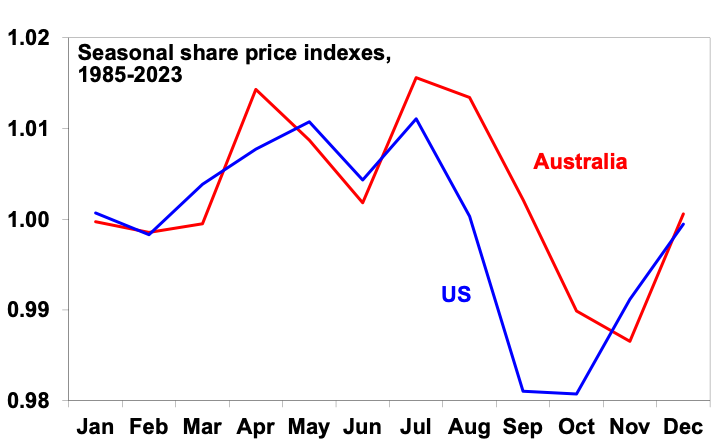
The broader seasonal pattern can be seen in the following chart which shows a monthly index for US and Australian shares after the longer term fundamentally driven trend is removed. The general picture of weakness into September often continuing into October – which is known as a “bear killer month” given the tendency for some bear markets to end in October – also gels with the historical tendency for many financial crises to occur around the August to October period – e.g. the 1929 crash, 1987 crash, the LTCM hedge fund crisis and the GFC.
The seasonal pattern in US and Australian shares
Source: Bloomberg, AMP
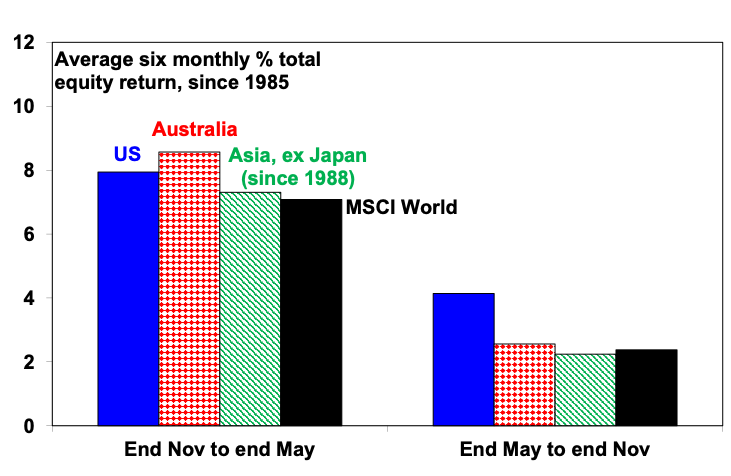
Or another way to look at it is to break a 12-month period into two halves. Since 1985, the average total return (from price gains and dividends) from US shares from the end of November to the end of May is nearly double that from the end of May to the end of November. Elsewhere the gap has been bigger.
A story of two halves
Source: Bloomberg, AMP
Observation of the seasonal pattern gave rise to the old saying “sell in May and go away, buy again on St Leger’s Day” which has its origins in the UK as St Leger’s Day is a UK horse race in September. In fact, it may have its origins in crop cycles with grain merchants selling their shares at the end of the northern summer to buy the summer crop (which depresses shares around August/September) and then buying back in after they sold the crop on to mills. Of course, that’s not so relevant today. The principal drivers in the seasonal pattern in the key US share market are likely to be:
-
investors and funds selling losing stocks to realise tax losses (to offset against capital gains) towards the end of the US tax year in September. This is also normally when capital raisings are solid;
-
investors then buying back in the final quarter of the year at a time when capital raisings wind down into year-end;
-
which then combines with the tendency for investors to invest bonuses early in the new year and new year optimism as investors refocus on the year ahead at a time when capital raisings are low. The illiquid nature of investment markets around late December and January makes these moves more marked.
Since 1985, November, April and December have been the strongest months for US shares. August and September have been the weakest. Consistent with US shares’ global influence, this pattern is also discernible in other countries. The strongest months of the year in the Australia have been April, July and December, with September the weakest.
But seasonal patterns appear to have weakened
However, there are several reasons to be cautious of relying on seasonal patterns to drive investment decisions.
Firstly, while the period from the end of May to the end of November may have provided weaker returns on average over the period since 1985, they have still tended to be positive, so getting out of the market in May in anticipation of weakness may not be justified on seasonality alone.
Secondly, the seasonal pattern has altered and softened a bit over time. The next chart compares the monthly pattern in returns over 2005-2023 to the period 1985-2004 for the Australian share market. May and June now appear to be weaker months, October’s weakness has been brought forward into September which is now the weakest month of the year (mainly because the October 1987 share crash drops out of the data for the latter period). But April, July and December remain the strongest months of the year, so some seasonal patterns still remain.
Seasonal patterns in Australian shares
Source: Bloomberg, AMP
There has also been a change in the seasonal pattern in the US with July looking stronger in recent times and December and January weaker as strength has been pulled forward into November. September has remained the weakest month of the year on average though.
Seasonal patterns in US shares
Source: Bloomberg, AMP
The change in seasonal patterns has weakened the concept of relative strength from end November to end May versus weakness from the May to end November. Over the period since 2005, the second period has actually been stronger than the first in the US and the gap has narrowed sharply in Australia, Asia and globally so it’s no longer so significant.
Average six month % equity return
Source: Bloomberg, AMP
Given the ongoing tendency for weakness in August and September though, and the clearer strength in July, perhaps the saying should now be, “sell in July and go away, buy again in October”. But that is a much shorter period which is arguably not worth timing for investors.
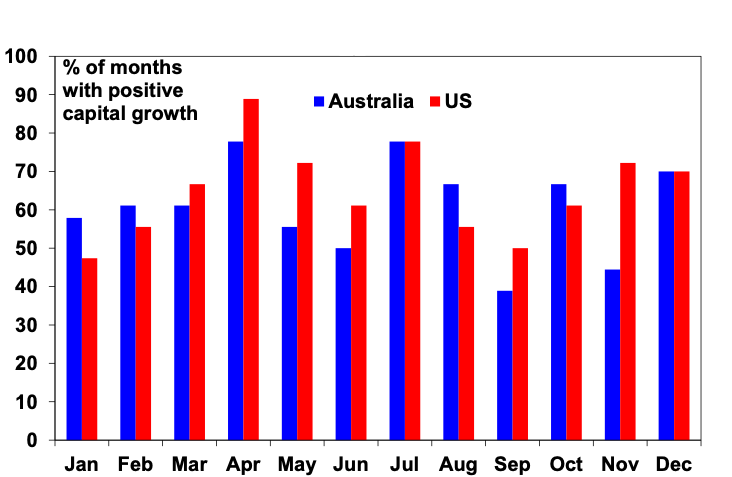
Thirdly, averages can be deceiving. The next chart looks at the proportion of positive returns in each month for the period since 2005. Again, the tendency for weakness in September is evident with less positive months. However, in the US, 50% of Septembers since 2005 have still been positive and in Australia 39% have been positive – so having a fall in September is no sure thing. And while April ranks as one of the strongest months of the year since 2005, 22% of Aprils in Australia have been negative and 11% in the US, as we have just seen in the past month with Australian and global shares down around 3%! So seasonal tendencies don’t always pan out as they can be swamped by other influences.
Percentage of months with increases – US & Australian shares, 2005 – 2023
Source: Bloomberg, AMP
What does it all mean for investors?
There are three key points here for investors: First, seasonal influences shouldn’t dominate an investor’s portfolio decisions – they appear to have changed a bit over time, such that there is less support for selling in May and they can be overwhelmed by fundamental influences, so they don’t apply in all years.
Second, they do provide some guide though to the pattern of markets through the year which investors should ideally be aware of in terms of decisions to buy and sell. In simplistic terms, around May or July is perhaps not the best time to be piling into shares and around September is not the best time to be selling them.
Finally, we continue to see shares having reasonable returns this year as inflation falls enabling central banks to ultimately cut interest rates. But they have had good gains since their lows last October and because of somewhat stretched valuations, uncertainty about the growth outlook and prospects for interest rate cuts, along with various geopolitical risks, are likely to see a more constrained and volatile ride over the remainder of the year than was the case in the first three months of the year. Of course, long term investors should look through all this.
Dr Shane Oliver – Head of Investment Strategy and Chief Economist, AMP
Source: AMP Capital May 2024
Important note: While every care has been taken in the preparation of this document, AMP Capital Investors Limited (ABN 59 001 777 591, AFSL 232497) and AMP Capital Funds Management Limited (ABN 15 159 557 721, AFSL 426455) make no representations or warranties as to the accuracy or completeness of any statement in it including, without limitation, any forecasts. Past performance is not a reliable indicator of future performance. This document has been prepared for the purpose of providing general information, without taking account of any particular investor’s objectives, financial situation or needs. An investor should, before making any investment decisions, consider the appropriateness of the information in this document, and seek professional advice, having regard to the investor’s objectives, financial situation and needs. This document is solely for the use of the party to whom it is provided.


